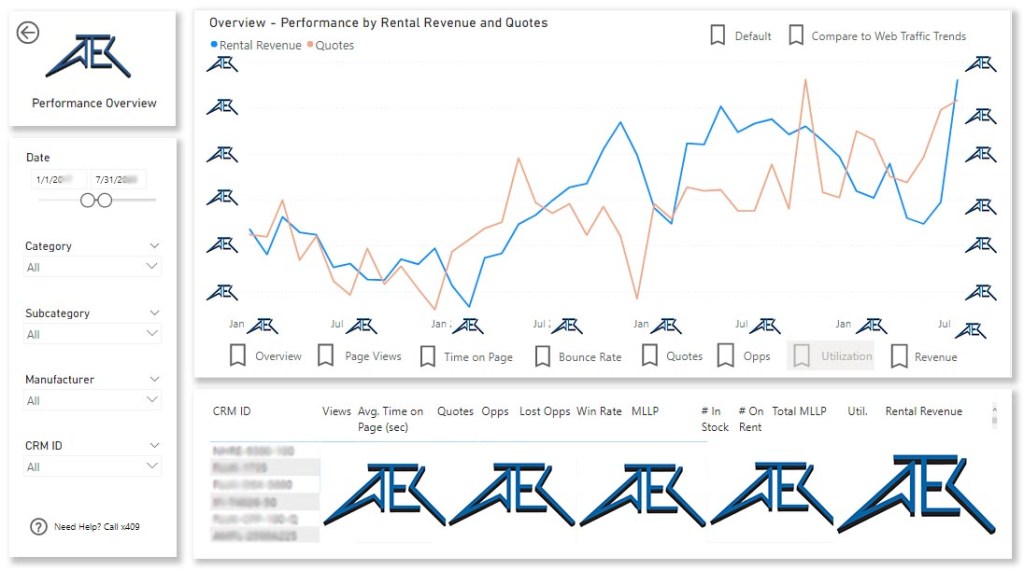
A business intelligence dashboard I designed with our amazing back-end developer, Jared, to inform our sales, inventory, and marketing strategy. We created it on Microsoft Power BI and brought in data from Microsoft Dynamics CRM, Google Analytics, and more sources.
Our goal? Give our company the power of data-based decision-making.
My contributions: Talking to key stakeholders to understand their jobs and how data could empower them and make their lives easier. Designing everything you see, from the aesthetic to the functionality. Most importantly: how to give the user an amazing experience in which their questions are answered – from the first few seconds they’re looking at the aesthetics and forming initial impressions, to the hours they may spend going deeper. My partner did all the data mining and querying, diving into the depths of our company data mines to find us the right tables and fields, and I couldn’t have done it without him. Working with him was some of the most valuable experience I got from this project
